Market Overview: Bitcoin’s Current Position
On the morning of Monday, Bitcoin (BTC) traded above $109,500, inching towards the $110,000 milestone. This modest upward trajectory comes after a weekend filled with significant market fluctuations, where many cryptocurrencies experienced pronounced drawdowns. As investors brace for possible continued turbulence, especially given September’s historical bearish performance for Bitcoin, the market sentiment remains fragile. Concerns linger that the downward price trend from August might extend into the upcoming month.
Historically, September has been a challenging month for Bitcoin, often marked by declines. With only two instances since 2017 recording positive returns of 7.3% and 3.9%, many investors are feeling an air of caution as they anticipate potential market movements.
Bitcoin monthly returns data | Source: CoinGlass
As attention turns to the next two weeks, economic data will serve as critical indicators leading up to the Federal Reserve’s anticipated interest rate decision in September, which could heavily impact risk-aligned asset classes like cryptocurrencies and equities. Current predictions suggest an impressive 87.6% chance that the Fed will introduce a 25 basis point cut to rates, potentially providing a much-needed boost to market sentiment.
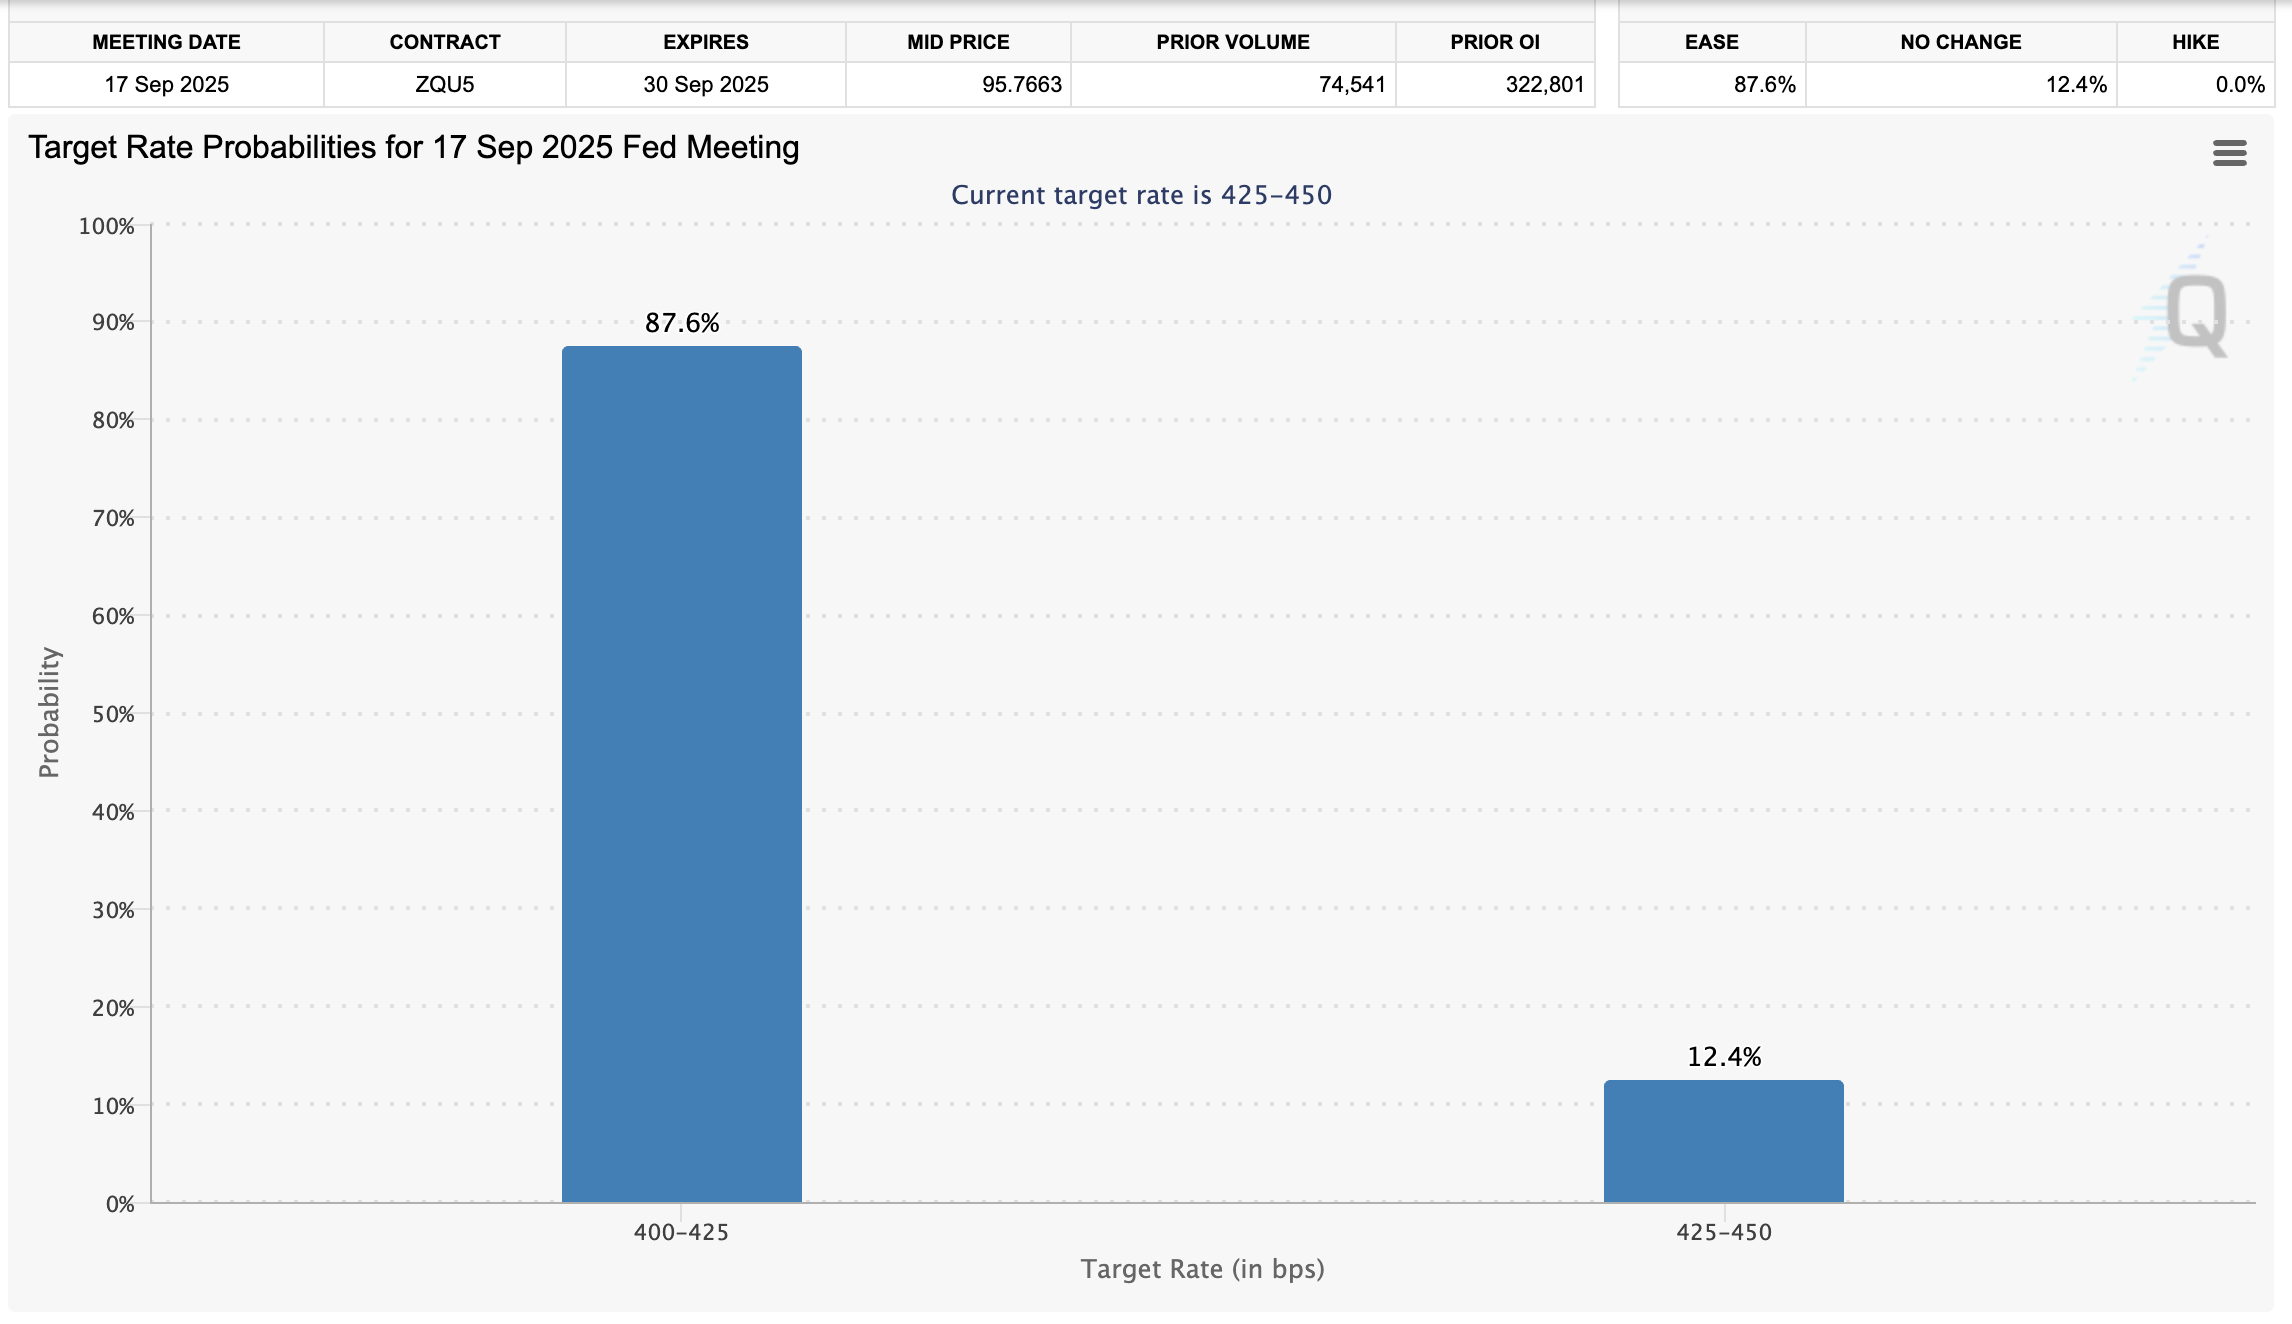
Fedwatch Tool | Source: CME Group
Ethereum’s Strong ETF Inflows
Meanwhile, Ethereum (ETH) has recently displayed promising signs of recovery, supported by a surge in institutional demand. Last week alone, Ethereum saw net inflows exceeding $1 billion into spot Exchange Traded Funds (ETFs), illustrating growing confidence from institutional investors.
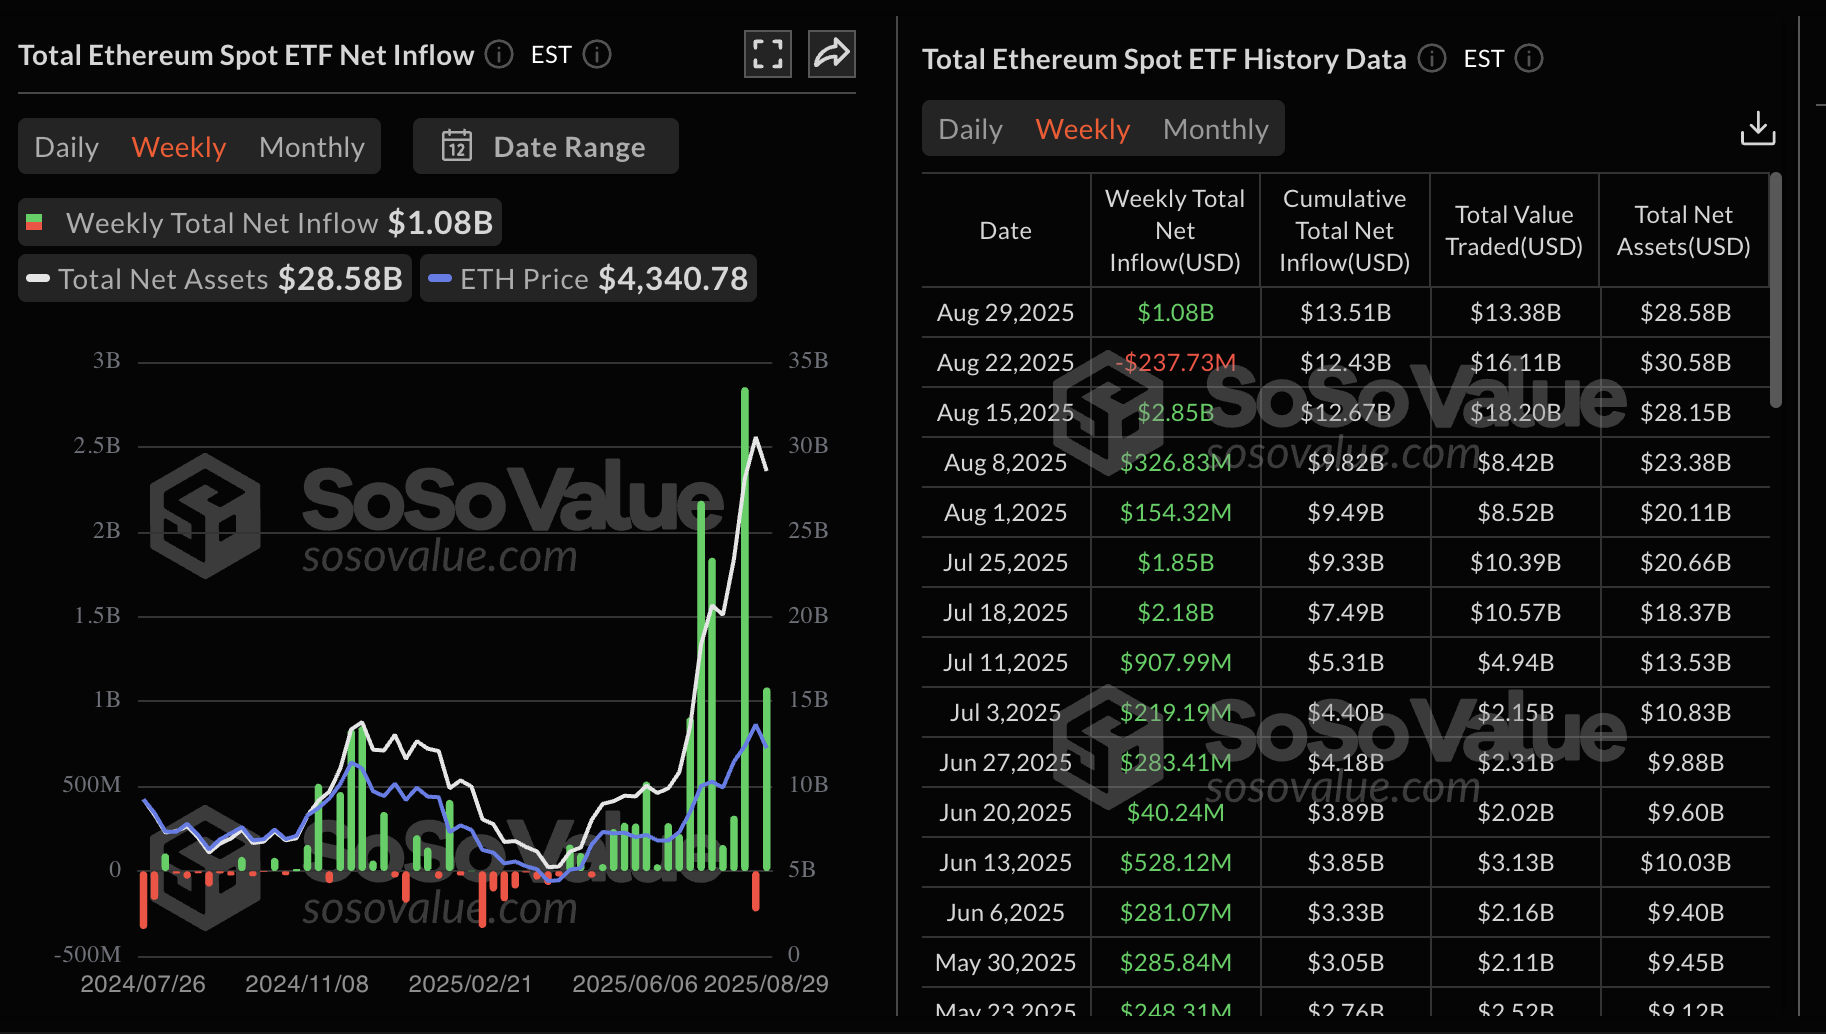
Ethereum spot ETF stats | Source: SoSoValue
In contrast, Bitcoin’s spot ETF inflows averaged $441 million, a decline from the previous week’s $1.17 billion in outflows. Cumulatively, last week’s digital asset inflows reached $2.48 billion, pushing August’s total to $4.37 billion. Year-to-date inflows have averaged $35.5 billion, bringing total assets under management to $219 billion, reflecting a 10% decrease from prior peaks.
Ethereum’s prominence is clear, with $1.4 billion in inflows compared to Bitcoin’s $748 million during the last week. Over August, Ethereum witnessed gains of $3.95 billion against Bitcoin’s loss of $301 million, bolstered by optimism surrounding U.S. ETFs for both Solana and XRP.
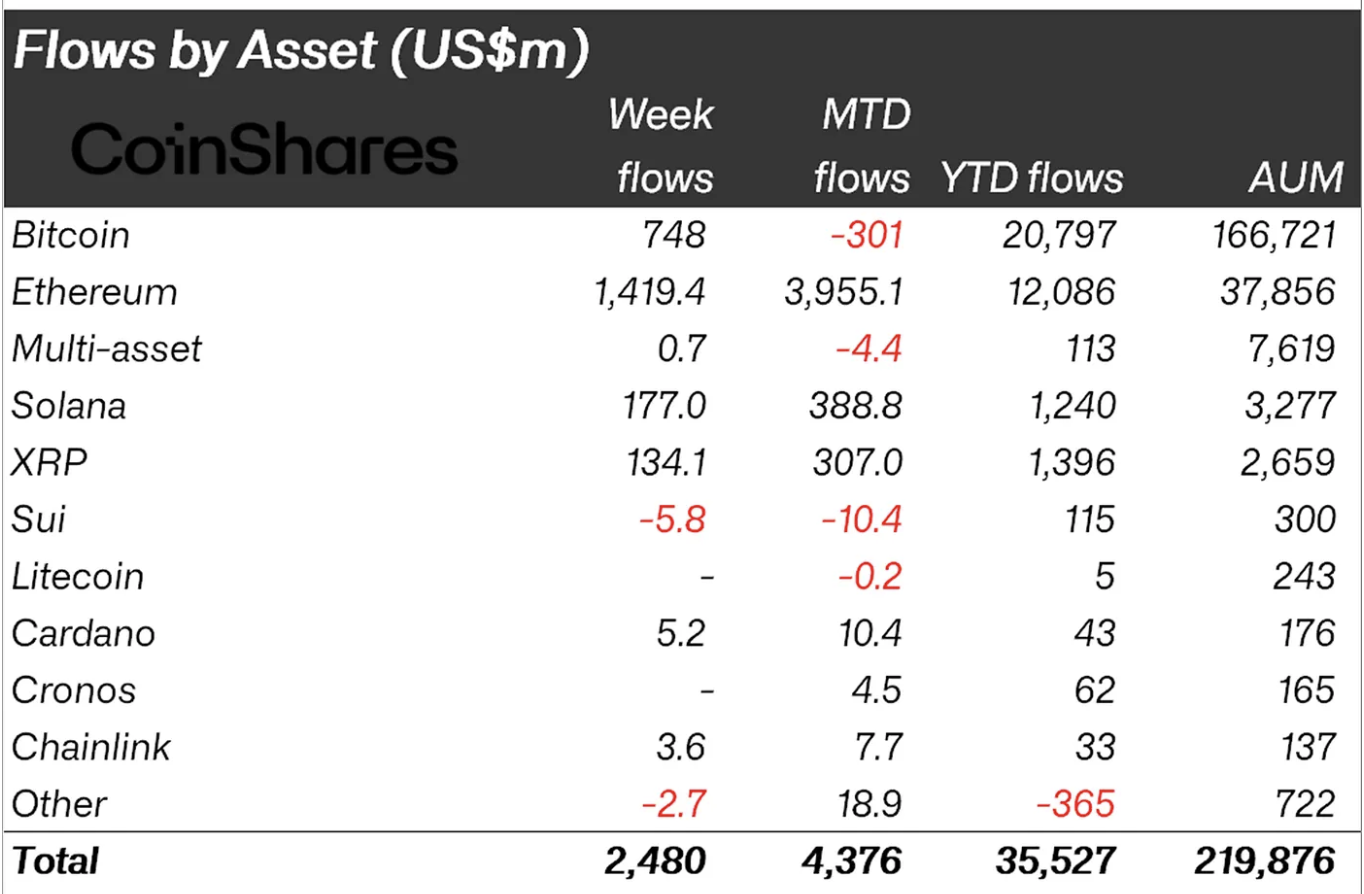
Digital assets capital inflows | Source: CoinShares
XRP’s Futures Open Interest and Market Sentiment
XRP remains in the spotlight, with its futures Open Interest hovering around $8 billion. This notable interest suggests a comparative enthusiasm as traders assess the market’s volatility surrounding XRP’s price movements. Understanding this metric can provide insights into overall market confidence and future pricing directions.

XRP Futures Open Interest | Source: CoinGlass
Chart Analysis: Bitcoin’s Potential Recovery
Currently, Bitcoin is attempting to recover from a recent dip that brought its price close to $107,000. As it trends above $109,500, bulls are pushing for a definitive breakthrough above the crucial $110,000 resistance level. Despite some bearish sentiments, the Relative Strength Index (RSI) is rising, reflecting a possible decrease in bearish pressure and indicating potential for upward momentum. An extended rise might propel Bitcoin closer to its $120,000 target this September.
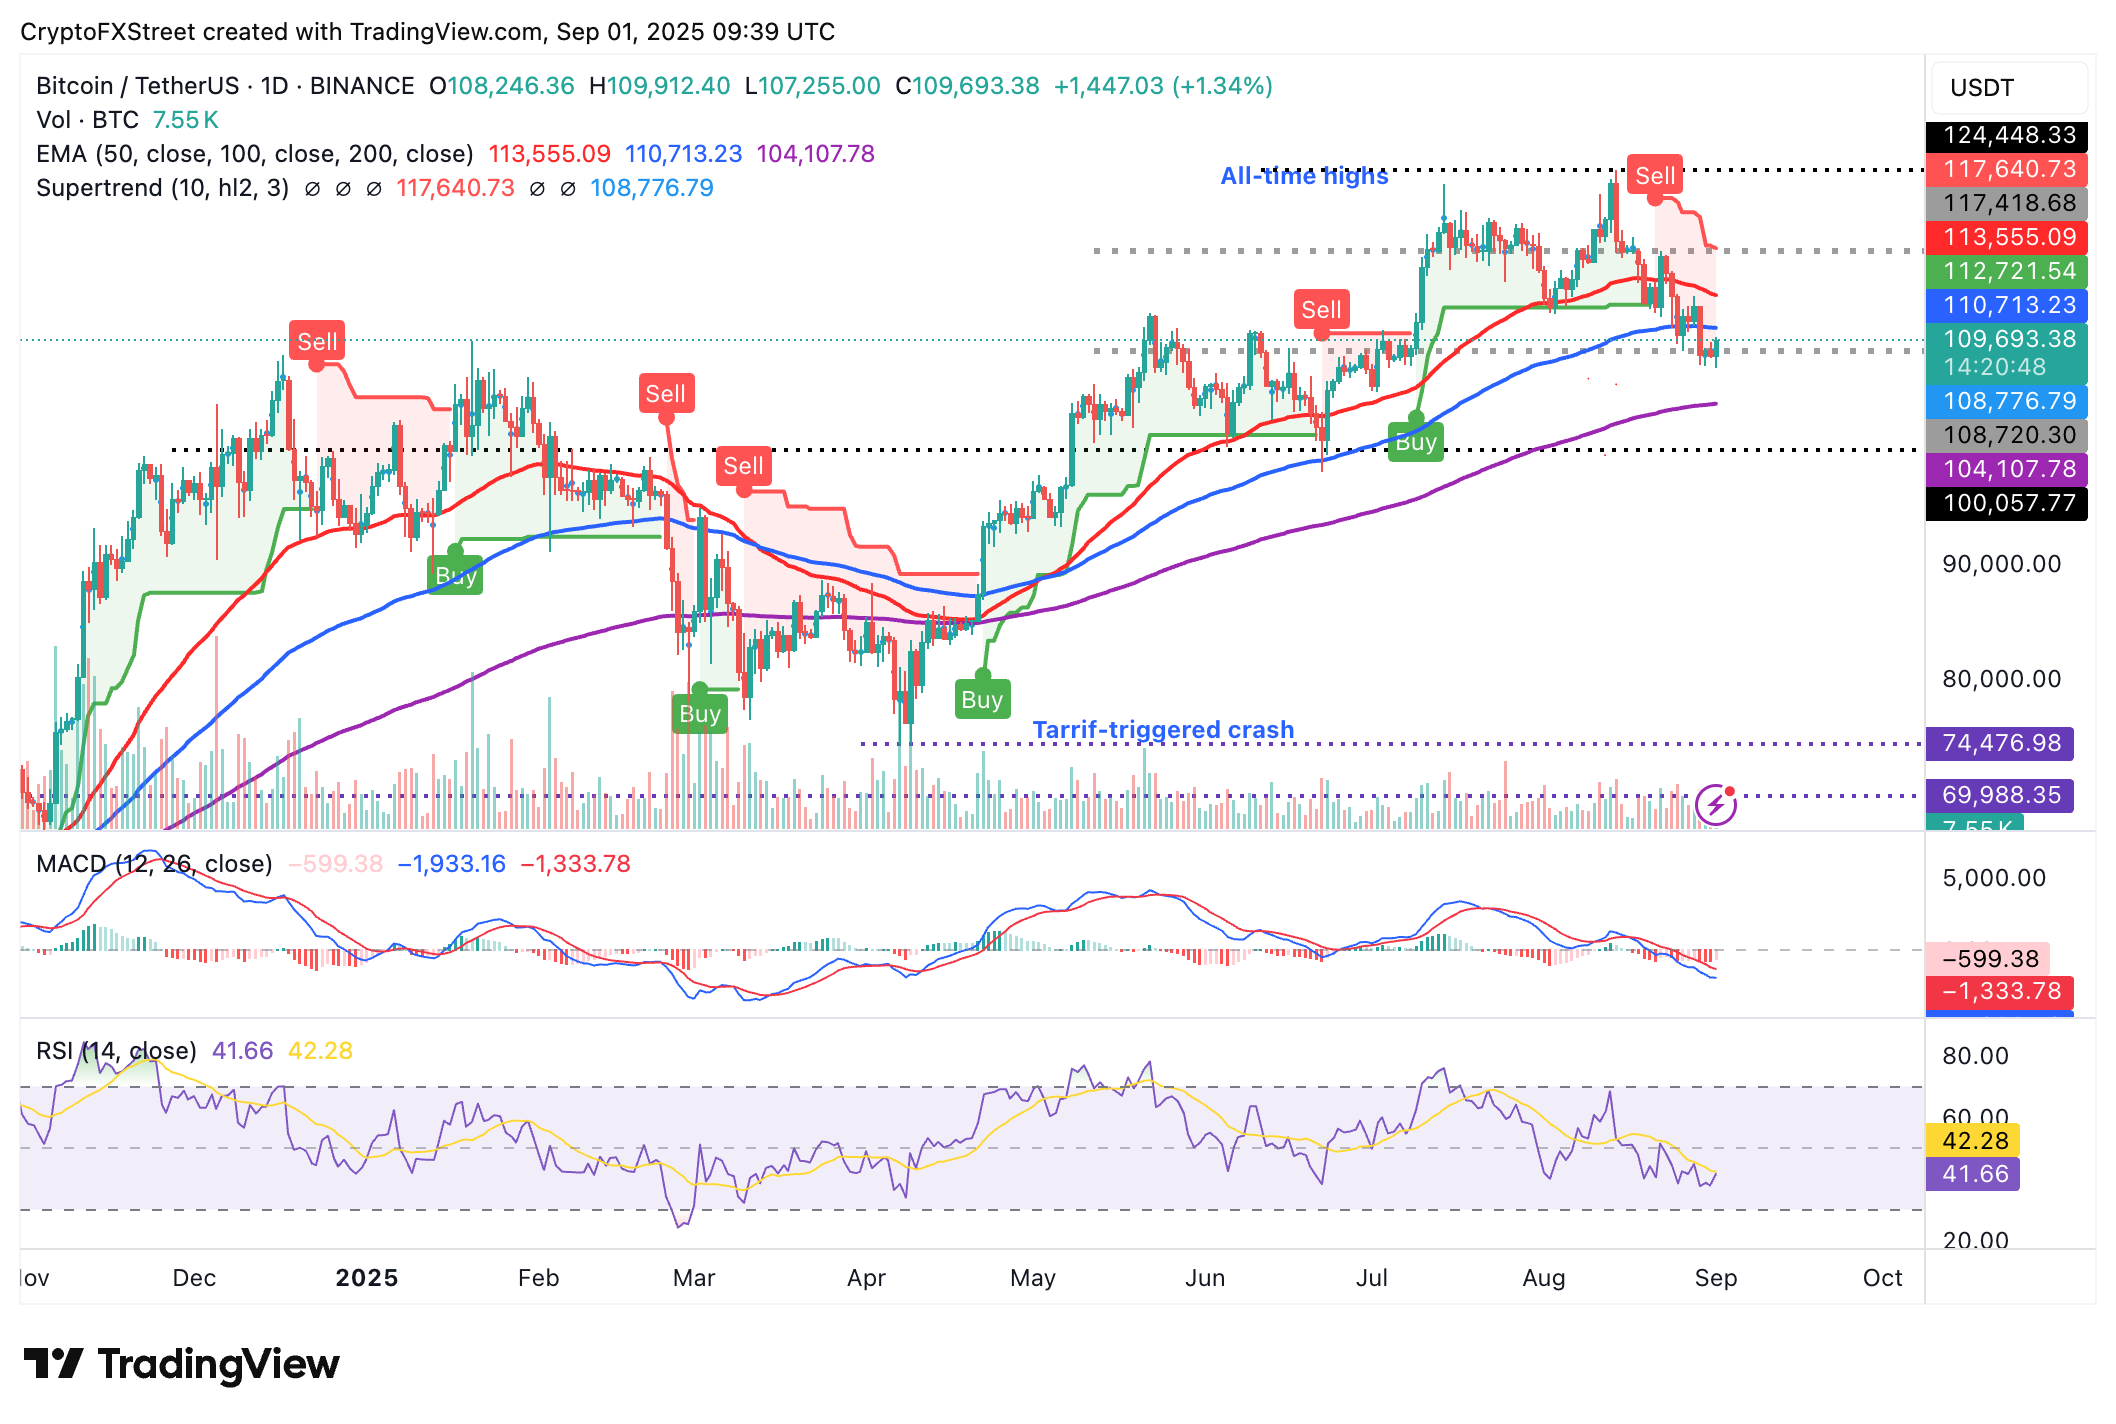
BTC/USDT daily chart
However, caution remains necessary. The Moving Average Convergence Divergence (MACD) indicator has been issuing sell signals since mid-August, signaling that Bitcoin could face renewed downward pressure, possibly targeting the 200-day Exponential Moving Average (EMA) around $104,107.
Altcoin Update: Ethereum and XRP’s Performance
Ethereum is navigating its way back towards the $4,500 mark, recovering from a Saturday low of $4,257. This positive turn is primarily driven by robust institutional interest in U.S. ETH spot ETFs, highlighting a strong demand for the asset class. The RSI for Ethereum is well-positioned above the midline at 54, supporting its upward potential.
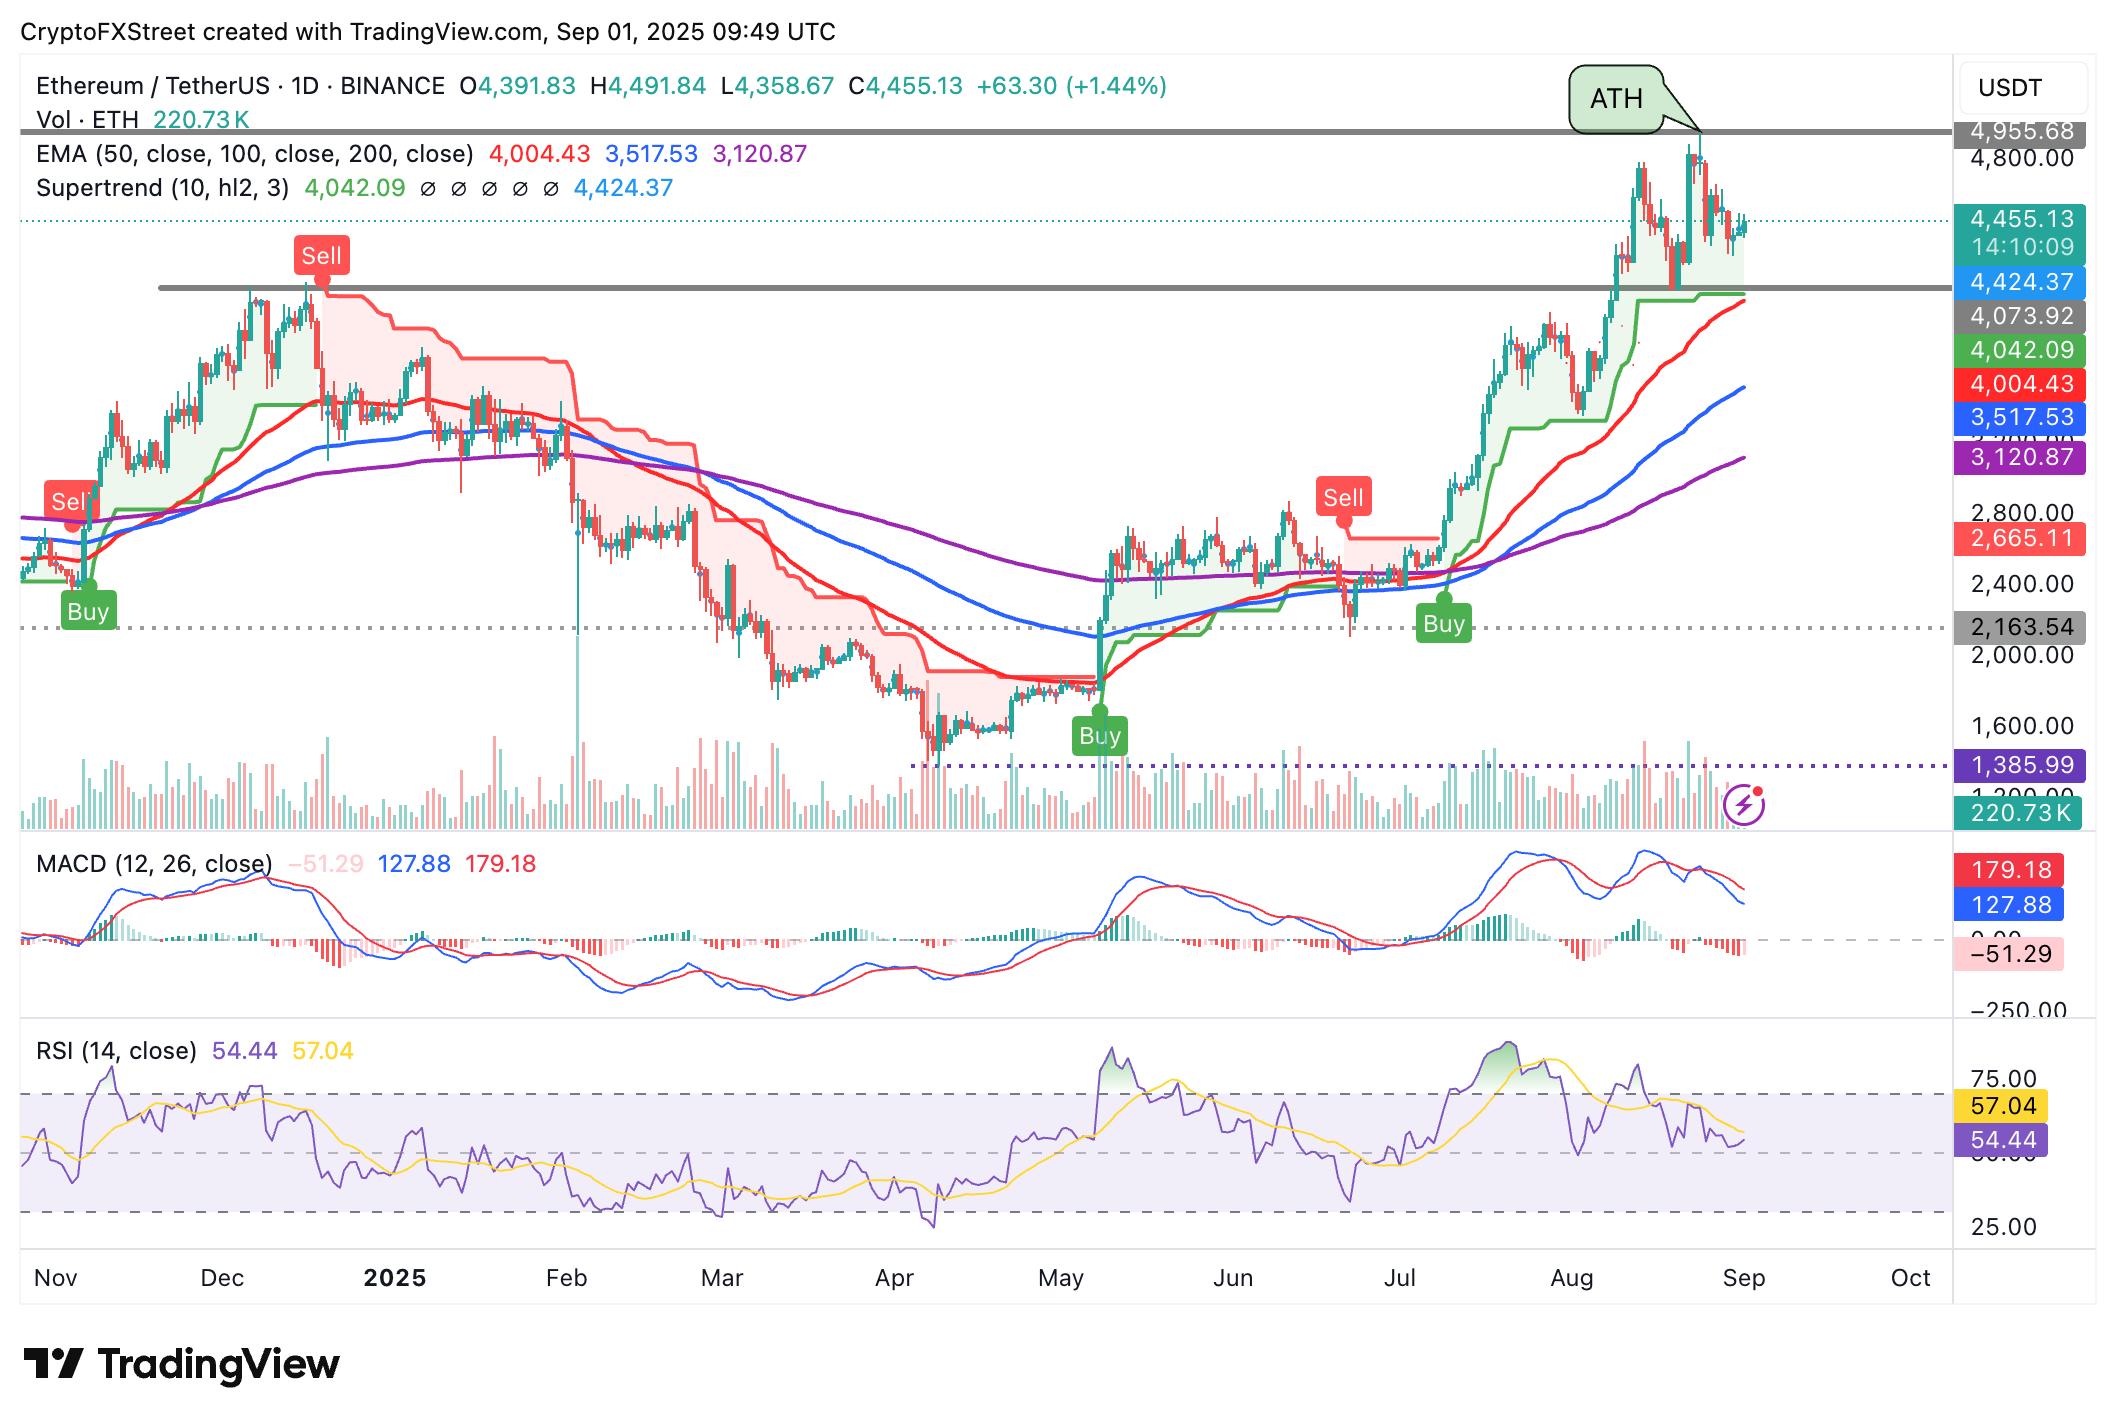
ETH/USDT daily chart
Furthermore, Ethereum remains above critical moving averages, including the 50-day EMA at $4,004, the 100-day EMA at $3,517, and the 200-day EMA at $3,120. These averages could provide necessary support levels should any downward pressure occur. A daily close above the $4,500 resistance could accelerate Ethereum’s recovery further toward its August 24 record-high of $4,956.
XRP’s technical structure also hints at potential bullish momentum, with the RSI rising towards the midpoint at 40. This upward movement could spur buyers, enhancing the chances of breaking the $3.00 resistance level. However, the MACD signal continues to reflect selling pressure, implying that traders need to navigate their positions carefully. The 100-day EMA at $2.76 and the 200-day EMA at $2.50 stand as critical areas that traders should monitor closely.
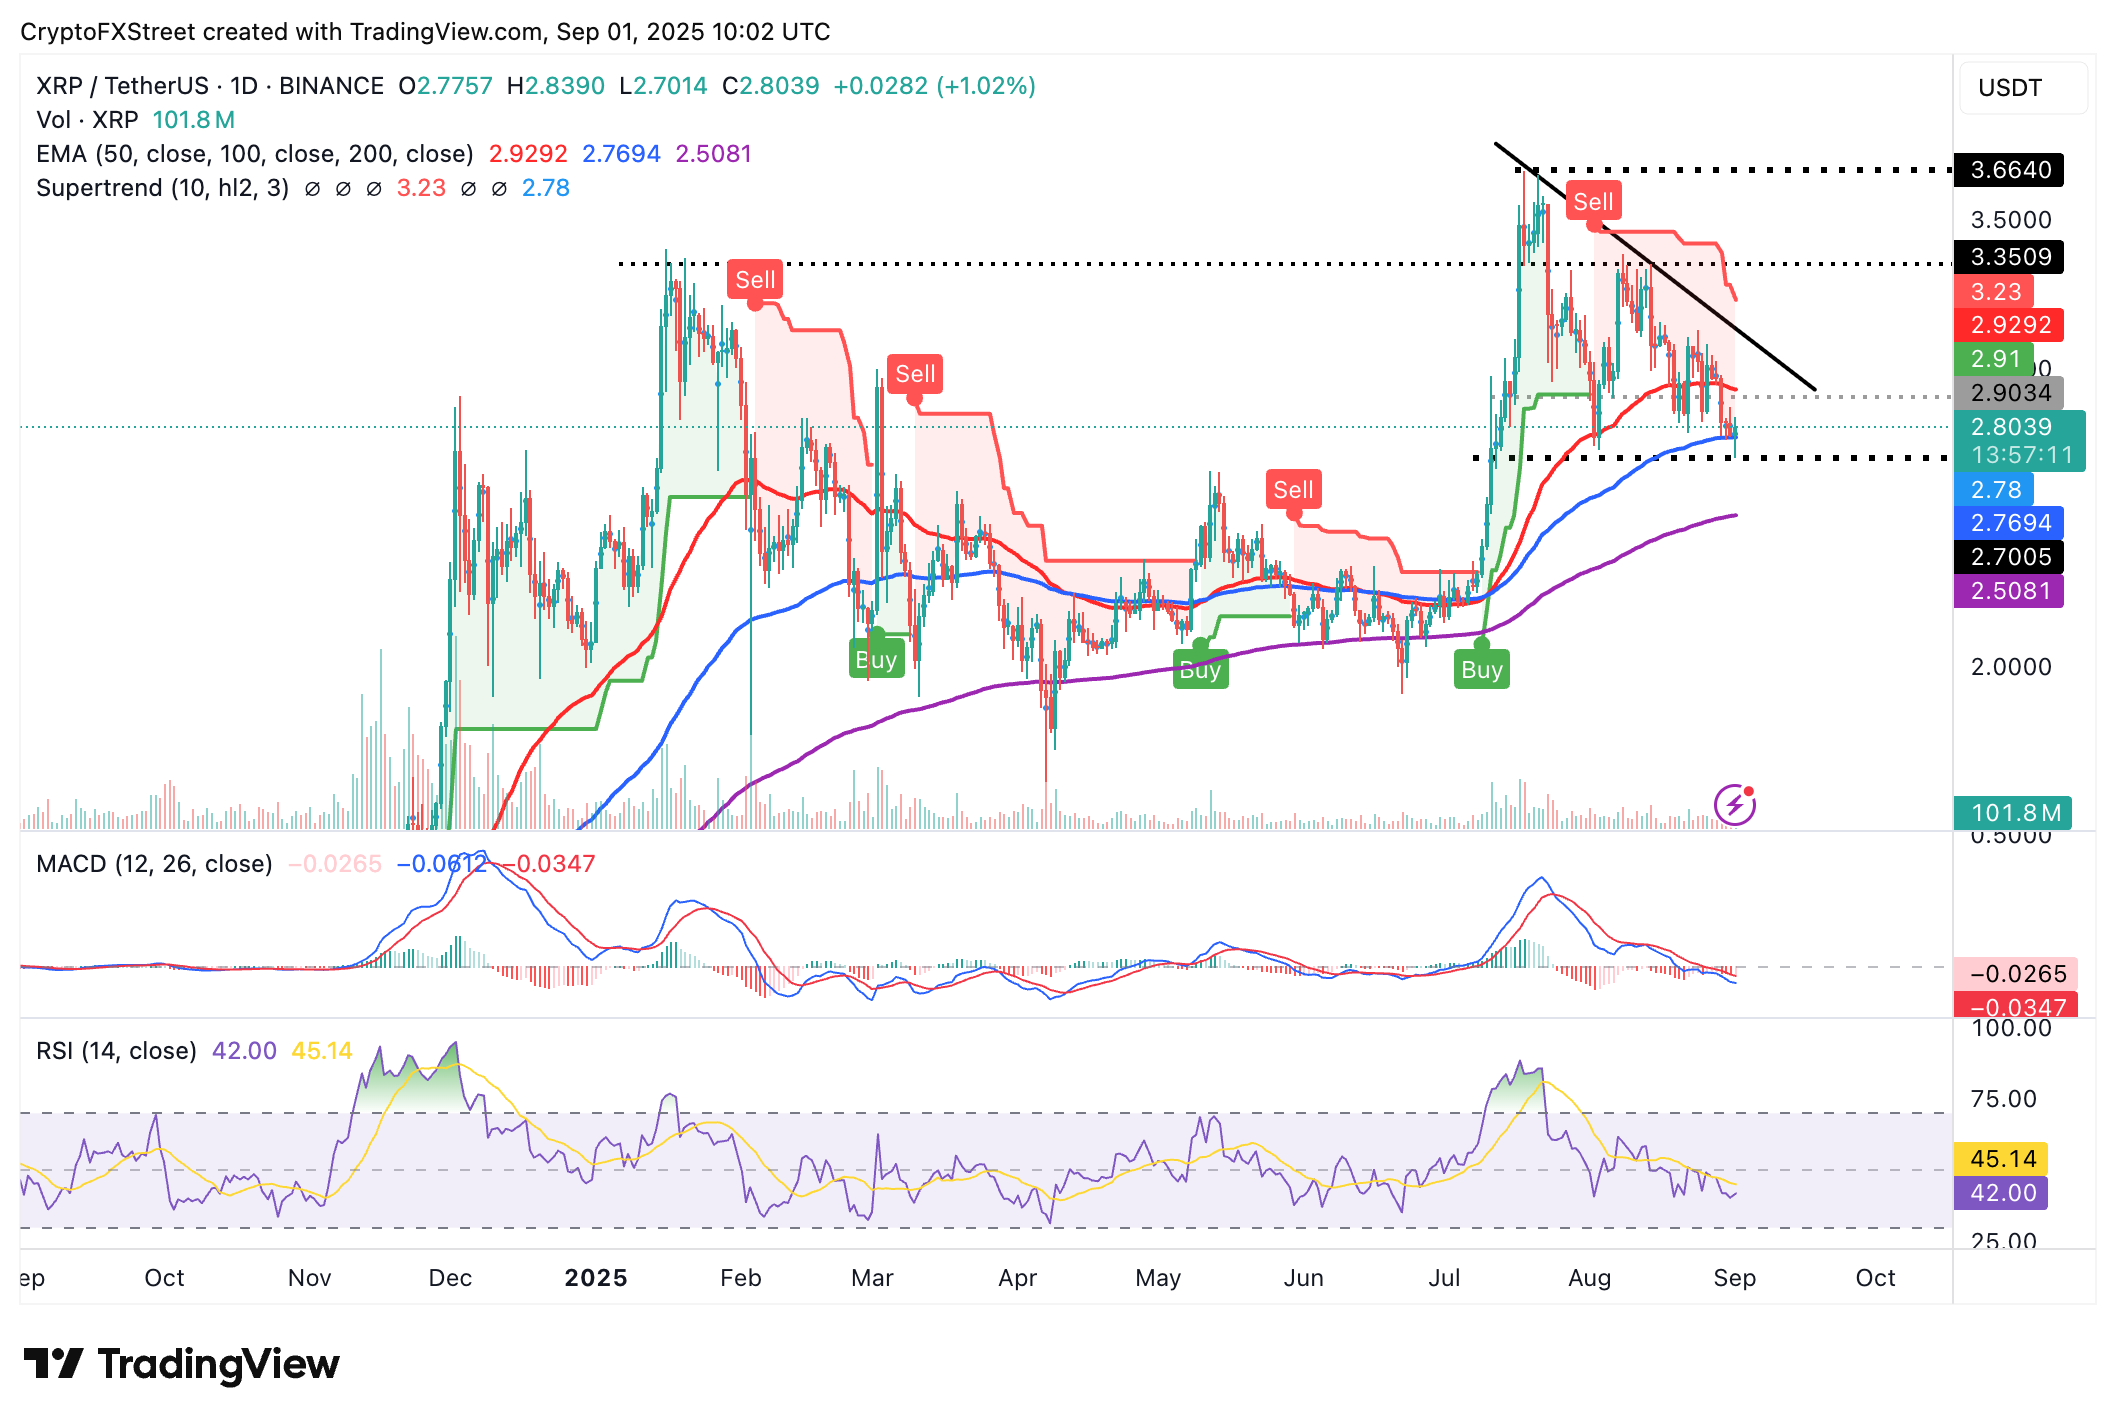
XRP/USDT daily chart
Bitcoin, Altcoins, Stablecoins FAQs
Bitcoin is the largest cryptocurrency by market capitalization, serving as a decentralized form of digital currency that operates independently of any central authority.
Altcoins, a term referring to any cryptocurrency other than Bitcoin, includes various digital currencies designed with unique features, some of which, like Ethereum, have achieved significant recognition.
Stablecoins are cryptocurrencies designed to maintain price stability by being pegged to a stable asset, like the US Dollar, helping facilitate smoother transactions in the volatile crypto market.
Bitcoin dominance reflects its market share relative to other cryptocurrencies, serving as a barometer for overall market interest in Bitcoin versus altcoins. A high BTC dominance often signifies a preference for the stability of Bitcoin during market volatility.
Disclaimer: For information purposes only. Past performance is not indicative of future results.