The Solana Price has cooled after a strong August. Over the past seven days, it has traded flat, and in the last 24 hours, it slipped 1.1%. By contrast, monthly gains still stand near 26%, and three-month gains are about 35.8%.
As traders scan the horizon for potential gains akin to those in August, the picture may not be as rosy as hoped. On-chain data suggests that profit booking has gained traction, while another significant indicator has quietly turned bearish. Together, these metrics raise questions about Solana’s capacity to sustain its upward momentum.
Two Metrics Hint At Active Selling
Recent on-chain data indicates that a vast majority of Solana holders are seeing profits. As of September 3, approximately 95% of holders were in the green, just shy of the six-month peak of 96.59% on August 8. Currently, about 87% of holders remain profitable, which is still considered an elevated level. When so many investors are sitting on gains, the temptation to cash out becomes compelling.
History supports this narrative. On August 2, for example, when the percentage of profitable holders dropped below 54%, the Solana price was around $158.53. In an impressive rally, the price then surged to $214.51 by August 28, marking a 35% increase. This trajectory indicates that Solana tends to perform well when fewer holders are inclined to sell their profits. Otherwise, upward price movements are often met with selling pressure.
Want more token insights like this? Sign up for Editor Harsh Notariya’s Daily Crypto Newsletter here.
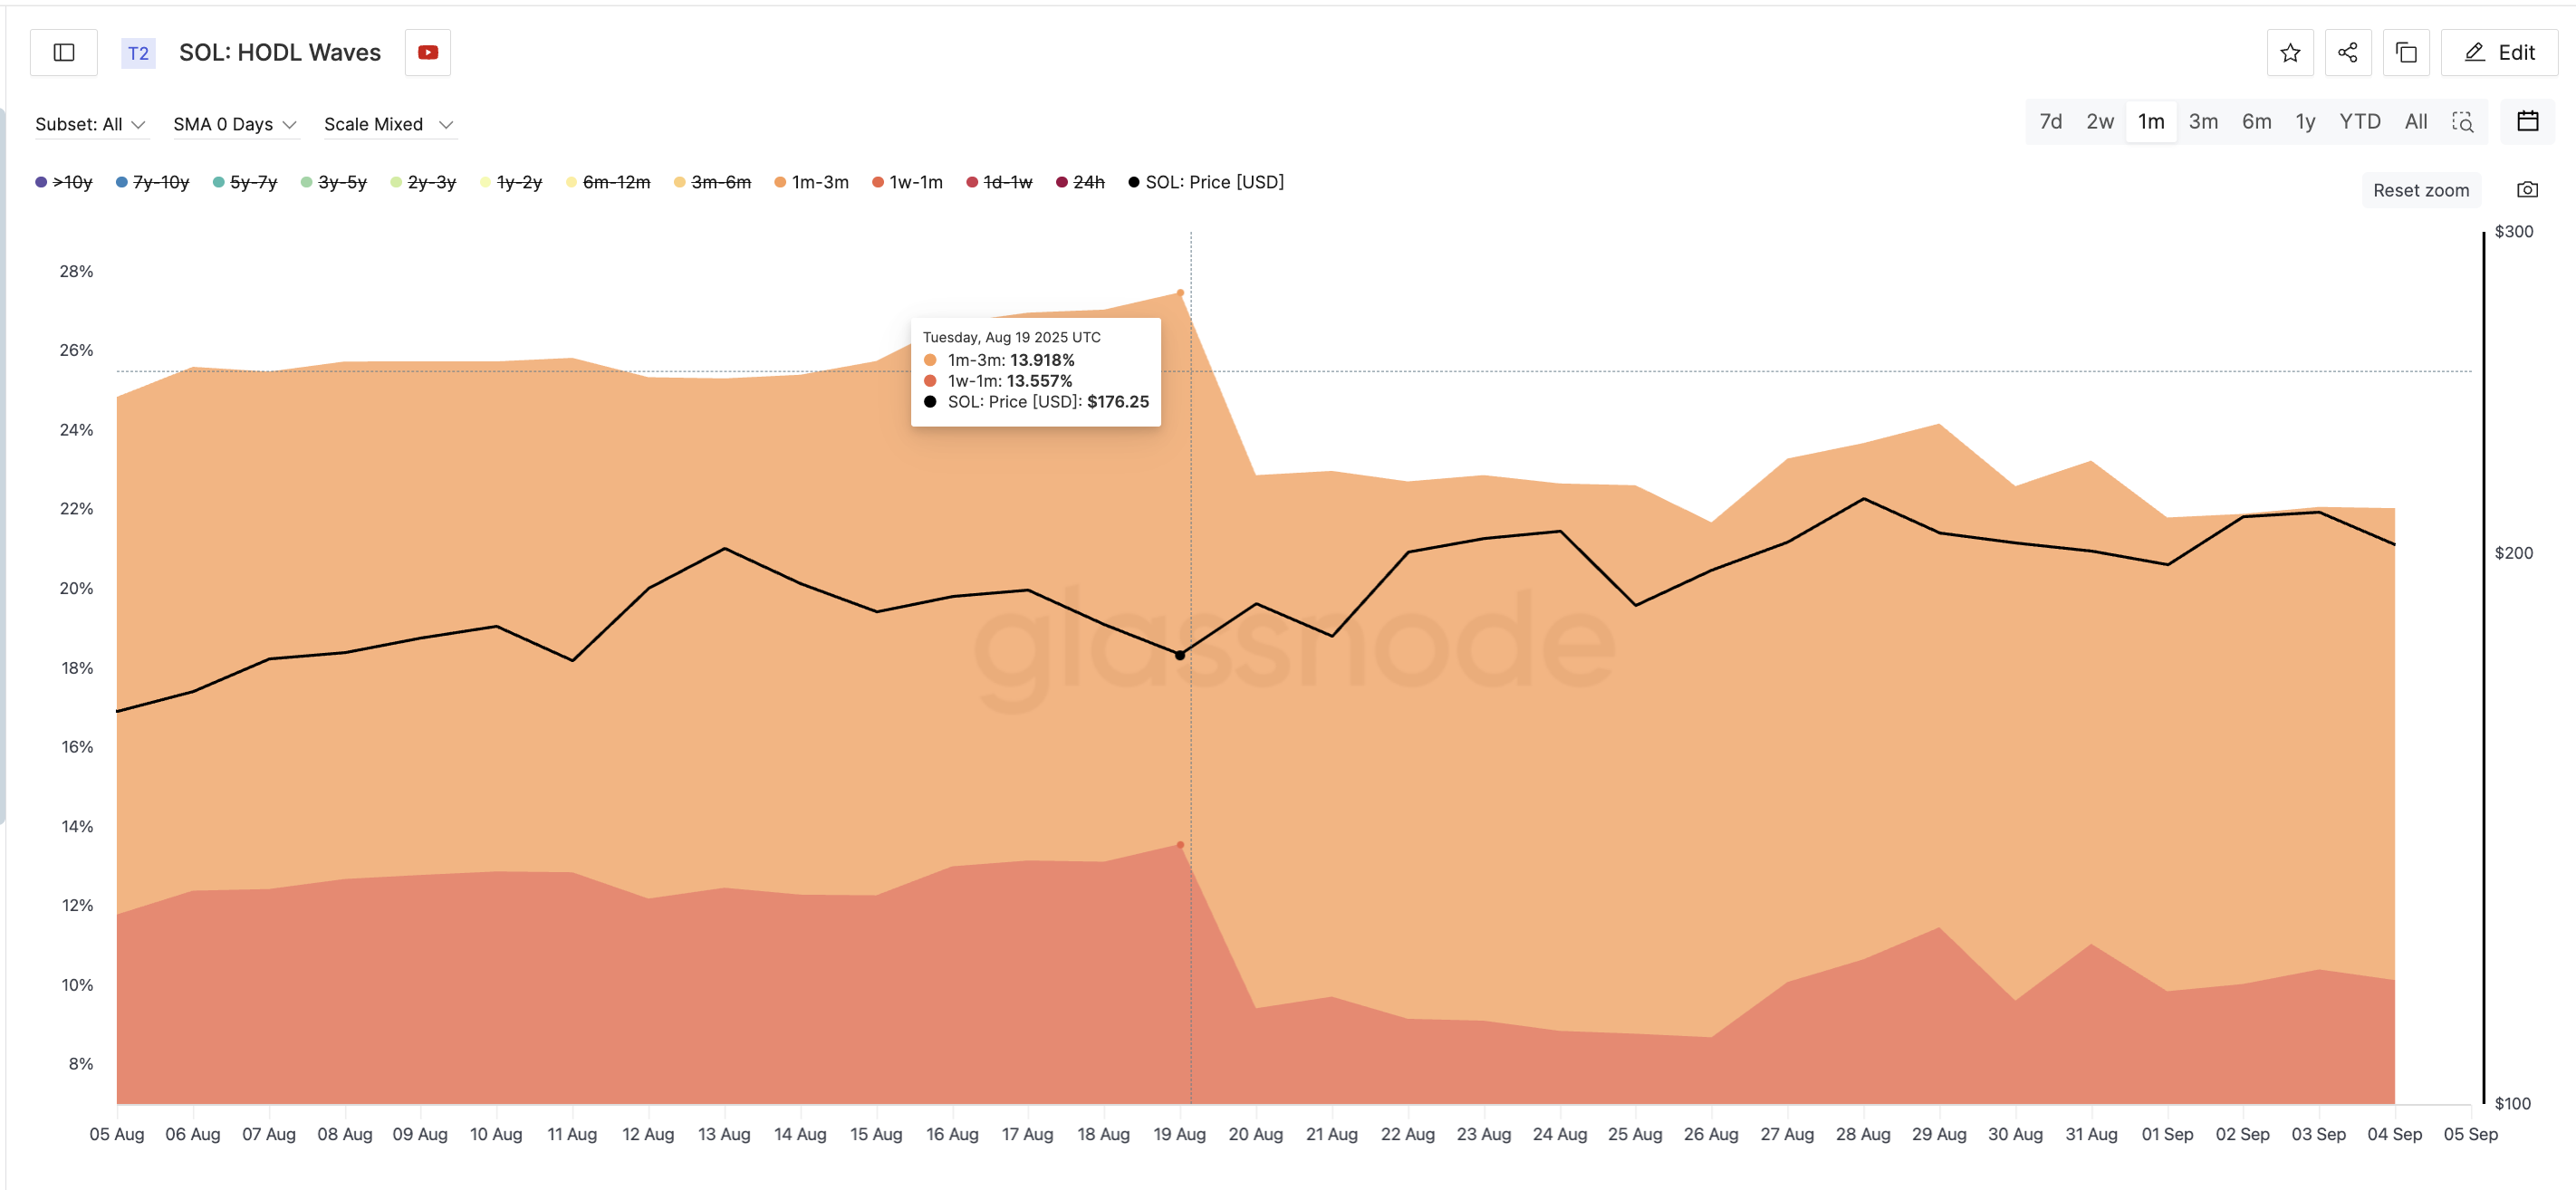
The HODL Waves metric, which tracks how long coins are held before being moved, corroborates this trend. Short-term holders—those who have held their Solana between one week to three months—reached a peak share of 27% on August 19, when the price hovered near $176. Since then, their proportion has dwindled to about 22%, indicating active selling behavior among these cohorts.
Weak Money Inflows Reveal the Solana Price Fragility
Looking at the price chart, the Solana price encounters substantial resistance at $218. A definitive close above this level would not only confirm a breakout but also invalidate the current bearish sentiment. However, persistent issues surrounding money inflow dampen any optimism.
The Chaikin Money Flow (CMF), an indicator of buying versus selling pressure, has sharply declined. On July 22, when the Solana price reached a local peak, the CMF was at 0.31, indicative of strong inflows. In contrast, despite recent price hikes, the CMF has subsequently dropped to –0.01.
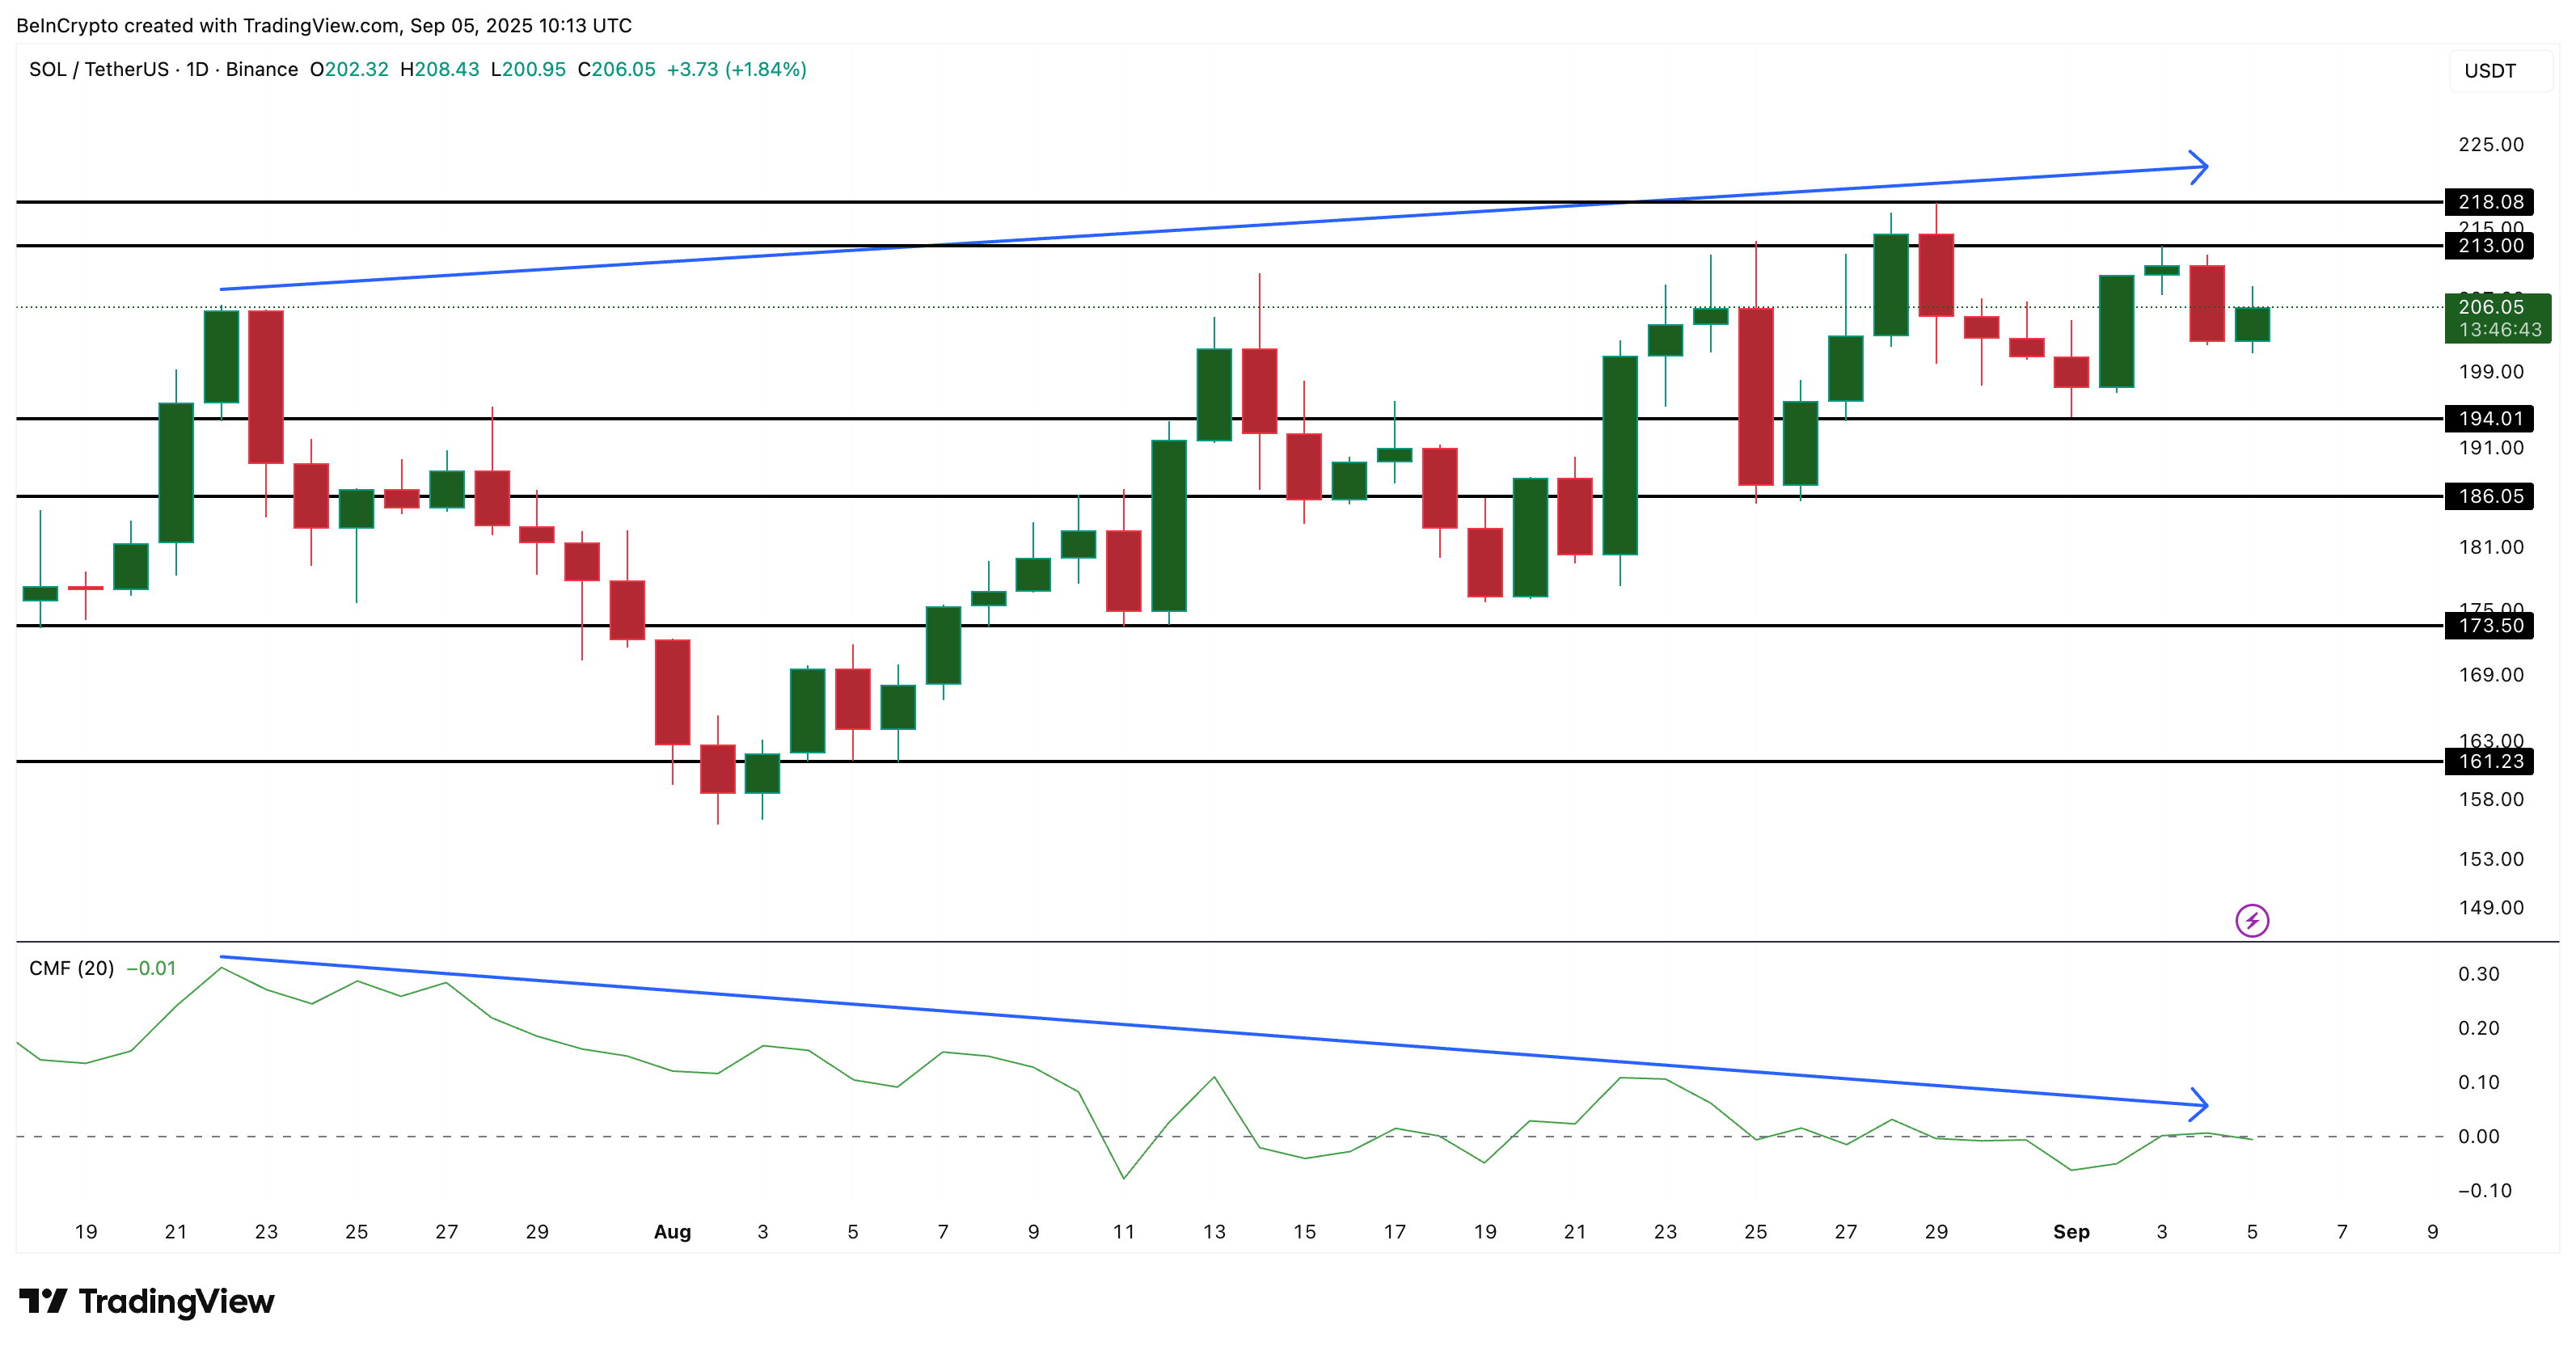
This divergence suggests that institutional and whale participation in Solana has been lackluster, limiting fresh capital inflows. In the absence of significant demand from these larger players, those looking to take profits face minimal resistance, making selling more attractive. The dearth of new buying also renders price rallies fragile, increasing the likelihood of pullbacks if critical support levels falter.
On the downside, support levels are solid around $194, with additional cushions at $186 and $173 should selling pressure amplify. Currently, while the Solana price remains stable, the lack of improvement in the CMF indicates that any imminent respite appears distant.